FCC Studies Show Consumers Generally Happy With Broadband Offerings
WASHINGTON, December 10, 2010 – The issue of competition among broadband providers has been greatly debated. Some claim that there is a cozy duopoly between cable and DSL while others claim that there is no competition due to lack of access. While it is true that not every area has a truly competit
WASHINGTON, December 10, 2010 – The issue of competition among broadband providers has been greatly debated. Some claim that there is a cozy duopoly between cable and DSL while others claim that there is no competition due to lack of access. While it is true that not every area has a truly competitive market, most areas do have at least a single cable and DSL provider. A recent set of white papers by the Federal Communications Commission looks at why users change their ISPs and how consumers feel about their ISPs.
A key finding is that nearly one-third of consumers have changed their ISP in the last three years. It is important to know that of those who switched just over 40 percent had moved in that time period.
Acknowledging that not all areas of the nation have competitive markets, the survey also specifically asked consumers in competitive markets if they would switch providers. Sixty-three percent said that they would.
The main reason why consumers have switched was for better service, which the FCC identified as speed. Followed by speed was price, with 47 percent claiming that they switched services to obtain a better price for their service needs.
The second white paper on broadband service provider quality showed that consumers are still not entirely sure about what they are getting. The survey found that most users understand their bill but do not know the details regarding the speed they have or termination fees.
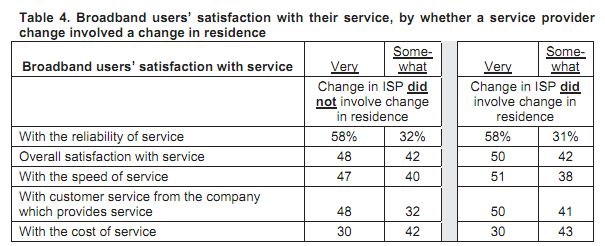
Most users are also very satisfied with the reliability of their service, but only half were satisfied with the speed. Thirty percent were satisfied with the price. The chart below describes the full breakdown.

Combining data from the two white papers, the chart below describes satisfaction levels of consumers who switched services but did not move.


