Report Using Census Block Data Finds Broadband Adoption Rate of 72.9 Percent
WASHINGTON, December 7, 2009 – A new report [https://broadbandbreakfast.com/wp-content/uploads/2009/12/Take-Rate-Brief.pdf] using an innovative approach to broadband data finds that the percentage of households in the United States that have adopted high-speed internet services is 72.9 percent. The
WASHINGTON, December 7, 2009 – A new report using an innovative approach to broadband data finds that the percentage of households in the United States that have adopted high-speed internet services is 72.9 percent.
The report was generated by comparing the Census blocks in which broadband is available with the number of subscribers that carriers report to the Federal Communications Commission.
By linking the number of subscribers in a particular state (from FCC data) to a data-set of Census block-by-Census block tabulations of broadband availability, consultant Brian Webster believes that he is able to peg the nation-wide broadband adoption rate for homes passed at 72.9 percent.
That number is about 10 percentage points higher than what other studies have found. That’s not surprising – precisely because he is attempting to count adoption of homes passed, and not of the population as a whole.
“That’s a difference that could have a significant impact on the decisions made to deploy broadband in the remaining un-served markets,” says Webster.
One other facet to the data used in the report: the FCC data used in the report also includes mobile broadband counts, in addition to wireline broadband counts. Because a home could have two or more broadband connections, the 72.9 percent number counts those homes twice.
Webster and his company are partners with Broadband Census Data LLC, which operates as BroadbandCensus.com. (Our news reporting on BroadbandBreakfast.com, and our popular Broadband Breakfast Club, are run by our sister company Broadband Census News LLC.)
BroadbandCensus.com worked closely with Brian Webster to produce what we believe is the first public and transparent broadband map, of Columbia, South Carolina, and Richland County.
That map, available on BroadbandCensusMaps.com, demonstrates, on a Census block-by-Census block basis, which blocks have broadband available, what technologies (e.g. cable, digital subscriber line) are offered, the speeds at which internet access is promised, and the names of the actual carriers that offer it.
Brian’s latest report doesn’t get into the speed, pricing, technology or carriers that offer broadband. Keep reading, however, to find out how BroadbandCensus.com, working with Brian Webster, can provide that for you.
Instead, the report links together three key sources of data:
- Data that is publicly released by the FCC as part of its Form 477 Report. (Most of the data — including crucial information about the names of broadband providers — is not publicly released.)
- Census Bureau data about population counts.
- Gadberry Group’s Broadband Served Indicator Data. (The Gadberry Group is a location-based services company.)
Look at this image, from the report, of the Census blocks in Arizona.
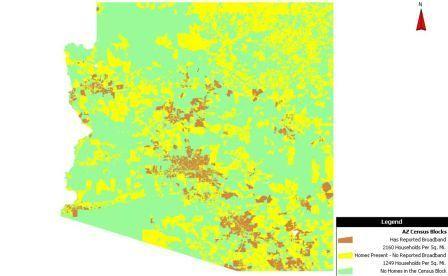
The brown represents Census blocks in which broadband is available. As you can see, the brown Census blocks are clustered around the major metropolitan areas, and other cities.
The yellow represents Census blocks in which there is no reported broadband — and in which there are households.
The green represents Census blocks in which there are no homes present at all.
According to the latest Form 477 data from the FCC, there are 1,575,252 residential broadband lines in the state of Arizona. This data is provided by the carriers.
According to the Census Bureau, there are 2, 722,725 homes in the state of Arizona.
Dividing the first number by the second generates 57.86 percent — or the “take rate” for the state, considered as a whole. In other words, for every 100 households, 58 take broadband.
But what about the “take rate” for only those homes that have broadband available to them?
Think of this number as an adoption rate for broadband services, where and when they are available.
By linking the public FCC database (and Census Bureau numbers) to the data-set from the Gadberry Group, Brian has been able to calculate this adoption rate of homes passed on a state-wide basis.
In other words, he can throw out all those Census blocks where there is either no broadband (the yellow) or no households (the green). Just totaling up the number of households in the brown Census blocks — whether or not the individuals household subscribe to broadband — yields 2,096,738 households.
Then, dividing the total number of residential lines by this reduced number of homes (in Census blocks in which broadband is available) yields a adoption rate of 75.13 percent. That’s a 17 percentage point difference from the raw “take rate” one would get by looking only at the FCC’s public Form 477 number.
There’s a lot of fascinating stuff here — and it’s really only scratching the surface of what is possible by building a public and transparent broadband database.
For starters, this analysis has been done only on a state-by-state basis.
BroadbandCensus.com has been urging the FCC to disclose not merely statewide numbers — but also those numbers on a county level, a ZIP code level, a Census tract level, a Census block group level, and a Census block level.
Developments may be moving in that direction. The National Telecommunications and Information Administration says that – as statewide broadband data becomes available – it is committed to releasing “the names of the providers at the address/Census block/street segment level (whichever level they collect at).”
They’d get a great head-start on that effort by persuading the FCC to release the entire Form 477 database. This is something that we at BroadbandCensus.com have been urging for more than three years.
Fortunately, states, cities, counties, carriers and other broadband stimulus applicants don’t need to wait for the FCC and the NTIA to begin building a map and data-set of Broadband Speeds, Prices, Availability, Reliability and Competition.
At BroadbandCensus.com, we call this the Broadband SPARC, and believe that a national broadband mashup is a key ingredient of a National Broadband Plan.
BroadbandCensus.com has built such a map in Columbia, South Carolina. We are available, on a very short turn-around, to map out the speeds, prices, availability, technologies and providers within individual states, counties and other geographic units.
If you’d like more information about the services that BroadbandCensus.com offers, please visit our web site, BroadbandCensus.com, e-mail us at data@broadbandcensus.com, or call us at 202-580-8196.
Editor’s Note: At about 11:30 a.m. ET, this posting was clarified to explain two reasons why Brian Webster’s adoption rate for broadband homes passed, at 72.9 percent, is higher than other studies of broadband adoption in the United States. They are: (1) Brian is only calculating broadband adoption of homes passed (or homes in Census blocks passed), and not broadband adoption as a percent of population; and (2) the FCC data used in the report also includes mobile broadband counts, in addition to wireline broadband counts. Because a home could have two or more broadband connections, the 72.9 percent number counts those homes twice.


