

White Paper
The 5G Promise Falls Short of Reality: Examining Economic Impact Claims
White Paper Provided by George S. Ford, PhD from the Phoenix Center for Advanced Legal and Economic Public Policy Studies
Over the past decade, the mobile wireless industry has promoted 5G as a transformative technology—one that will boost the U.S. economy by over $1 trillion and create millions of jobs. They described 5G not just as a faster internet connection, but as a technology that will transform everything affecting the average American’s life—from healthcare and transportation to manufacturing and education. The industry’s claims have shaped public policy debates, influencing decisions about spectrum allocation, infrastructure investments, and regulatory priorities.
But once 5G began to roll out, the mobile wireless industry’s big promises started to face serious questions. Many users noticed little difference between 5G and the previous generation (4G). Some media outlets and tech experts called 5G an “overhyped technology bust.” And as talk of 6G begins to emerge, it’s worth asking: Has 5G really delivered the massive economic benefits we were promised?
This Paper examines that question using federal data on 5G availability and key economic indicators across U.S. counties, which vary in 5G deployment. The findings are straightforward: there is no evidence that 5G deployment has improved employment, wages, business growth, personal income, or GDP. Despite the industry’s sweeping promises, the data show no measurable economic impact from 5G so far.
This result does not imply that 5G lacks value— better connectivity can support specific use cases and improve service quality. But this result does raise serious doubts about the narrative that 5G is a fundamental economic game-changer. As the industry begins to promote 6G and to seek additional spectrum, policymakers should proceed with caution. Public resources and regulatory choices should be guided by evidence—not marketing campaigns. This analysis provides a grounded perspective to support more realistic, outcome-driven telecommunications policy.
Background
America’s mobile wireless industry seems in constant need of additional radio spectrum. With the evolution of networks to 5G, the industry launched a marketing campaign promising substantial economic benefits. For example, according to a 2021 Boston Consulting Group (“BCG”) study commissioned by CTIA, “5G will become a foundation for innovation” and it will have “broad and deep economic implications both by industry and by region.”[1]
Indeed, the industry claimed “5G deployment will contribute $1.4 trillion to $1.7 trillion to US GDP and create 3.8 million to 4.6 million jobs in the next decade.”
Along the same lines, a January 2025 study by NERA commissioned by CTIA claims that “each additional 100 MHz of mid-band spectrum to mobile will generate $264 billion of GDP, about 1.5 million new jobs, and about $388 billion in consumer surplus.”[2] Citing these results, CTIA argues that access to more spectrum will therefore “supercharge America’s economy, boost[] GDP, creat[e] new jobs, benefiting consumers and helping to close the digital divide."
Accordingly, the industry’s narrative portrays 5G not merely as an incremental improvement over previous wireless generations, but as a “technological paradigm shift, akin to the shift from typewriter to computer” capable of delivering “significant socioeconomic benefits through higher productivity, improved cost competitiveness, and better health and safety.”
The first 5G towers came online in late 2018, 5G mobile devices were offered in 2019, and the service only became mainstream in 2020. While consumers certainly appreciated faster connectivity, they soon discovered that the performance of 5G is networks is mixed. Some consumers that tested 5G against 4G services found no difference in speeds.[3] Research by Ookla suggests about a 26% improvement in page download speeds between 5G and 4G connections, revealing only a modest improvement. Unsurprisingly, it was not long thereafter that media outlets and others began to label the industry’s sweeping narrative about the broad economic effects of 5G as mostly hype.
Deloitte reported in November 2024 that “[t]he deployment of 5G standalone networks is progressing more slowly than expected,” due in part “to underwhelming returns on ... existing 5G investments.” Even McKinsey, a firm generally optimistic about 5G’s potential, acknowledged in 2021 that only “a few use cases can only be done with 5G,” undermining industry claims of revolutionary transformation. A McKinsey survey of telecommunications industry professionals found widespread uncertainty about 5G’s economic potential, with two-thirds of operators stating “they still have questions around the financing of it, and roughly 60 percent of respondents indicating they struggle with the business case.” McKinsey has described the industry’s 5G narrative as “hype” and perhaps “more of the same.”[4] Making matters worse, subscription and bandwidth growth in the mobile wireless industry has stagnated, weakening investment incentives.
Yet perhaps the best rebuke of the 5G hype came from Senator John Kennedy (R-LA), who remarked on the Senate floor: “there is going to be a lot of hype from the telecommunications companies” about 5G, “they are going to tell you that 5G can grow hair, that 5G can cure erectile dysfunction, that 5G can do this and it can do that.” Senator Kennedy’s colorful characterization may be exaggerated, but not by much—the mobile wireless industry has long been prone to fantastical claims.
The industry’s narrative, typically voiced by CTIA, often focuses on the stunning, broad economic returns of its investments and spectrum gains. But are these economic returns observable in the data? Let's turn to that question next.
Empirical Framework
5G deployment began in earnest in 2019, providing sufficient time to observe its economic effects across the United States. To capture the economic trends before and after 5G implementation, this analysis examines county-level data on several broad economic outcomes from 2014, 2015, 2016, 2017 and 2018 (pre-5G) compared with 2022 and 2023 (post-5G deployment) using Difference-in-Differences analysis. The standard two-way fixed effects regression is,
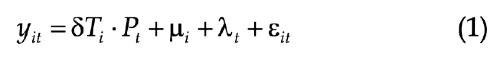
where yit is the outcome in county i and time t, Ti measures the deployment of 5G services, Pt is a treatment indicator, μi is a county fixed effect, λt is a year fixed effect, and εit is a random disturbance term. The treatment variable Ti is continuous. Standard errors are clustered at the county level.
Under certain conditions, the δ coefficient measures the causal effect of 5G deployment on county-level economic outcomes. The key concerns here are selection bias and parallel paths. 5G was not randomly deployed and presumably prioritized area with favorable economic fundamentals (e.g., large cities were first). This selection process can introduce bias in the DID estimates.
To address this concern, we can employ Inverse Probability Weighting (“IPW”). IPW makes the treated and control groups more similar by assigning large weights to the treated that are most like the controls and large weights to the controls that are most like the treated.[5] 5G deployment levels are highly correlated with county size, and thus the economic outcomes, so selection bias is surely an issue and a difficult problem to address. Based on Naimi, et al. (2014), the IPW is constructed based on the normal density approach using a model with 5G coverage as the dependent variable and including (the natural log of) population (and its square), population growth (five-year), and state fixed effects using the 2018 data.[6] Common support across the IPW for the control group is imposed.
Also, the standard DID approach assumes that treatment and control groups would have followed parallel trends in the absence of treatment. I evaluate the plausibility of the parallel paths assumption in two ways: different slopes in the pre-treatment period and testing a false treatment in 2018.
In the absence of parallel paths, Equation (1) may be augmented with county-level linear trends, so the regression model is,

where the θit are county-specific time trends.[7] Including county-specific linear trends addresses the parallel paths assumption problem by allowing each county to follow its own growth trajectory over time, rather than requiring all counties to follow parallel trends before the 5G deployment. These county-specific time trends adjust for pre-existing differences in growth trajectories between counties that received more intense 5G deployment and those that received less, relaxing the strict parallel trends assumption and making the estimate of δ more credible. This specification assumes that linear trends account for differences in the paths of the outcomes.
Data
The analysis leverages fine-grained 5G availability data from the National Broadband Map as of December 2022, which are aggregated to the county level to measure the intensity of 5G infrastructure deployment. These data include four measures of 5G deployment (7/1 Mpbs and 35/3 Mpbs, stationary and in-vehicle) with a minimum cell edge coverage probability of 90% and a cell loading of at least 50%. The treatment is defined as the faster service averaged over the two use types. The mean of Ti is 0.29 with a minimum of 0 and maximum of 1.0.
Economic indicators include total employment, total wages, and total business establishments for private industry from the Census Bureau’s Quarterly Census of Employment and Wages (“QCEW”) and personal income and Gross Domestic Product (“GDP”) data from the Bureau of Economic Analysis (“BEA”). Total wages are constructed by multiplying mean annual wage by the employment count. Outcomes data in estimation include years 2014, 2015, 2016, 2017, and 2018 as the pre-treatment period, and 2022 and 2023 as the post-treatment period.[8] All outcomes are log transformed.
The balanced panel has 21,406 observations with 3,058 counties and seven periods, though the estimation sample is smaller (20,545 observations and 2,935 counties) due to the common support restriction.[9] The mean of Ti is 0.27 (down from 0.29) in the estimation sample with a range of 0 to 1, so the restricted sample is largely comparable to the full sample.
Results
To evaluate parallel paths, two approaches are used. First, the differences in the slopes across the treatment are tested by regressing the outcomes on time and time interacted with Ti. The null of equal growth rates is rejected for employment, personal income, and establishments. Second, a false treatment in 2018 is used to estimate Equation (1) on the pre-treatment sample. If the null of the false treatment is rejected, then the parallel paths assumption is unsupported. The
null hypothesis is rejected for employment, total wages, and establishments. Results are summarized in Table 1.
Thus, Equation (1) is suitable for GDP while Equation (2) is the better specification for the other outcomes given evidence of the lack of parallel trends. Once accounting for the trends, the null hypothesis of the false treatment in 2018 is not rejected for any of the outcomes.
Results are summarized in Table 1. All regressions are weighted by the IPW. For all
outcomes the δ coefficients are small and none are statistically different from zero. The models have poor explanatory power (with small F- statistics). There is no evidence that the level of 5G deployment has improved these broad measures of economic outcomes at the county level for the time periods in the sample.
To obtain a “non-parametric” estimate of the effects, the 5G coverage variable is cut into deciles. The first decile is excluded to avoid the dummy trap, so all the effect sizes measure differences from the first decile and the t-statistics are a direct test of the null hypothesis that the difference between deciles is zero. The first decile has a range of 0% to 0.033%, or essentially no 5G coverage. There are nine indicator variables for five different outcomes, rendering 45 coefficients to be estimated. None of the 45 coefficients is statistically different from zero. These results tell the same story as the continuous measure of coverage—there is essentially no observable effect of 5G coverage on the broad measures of economic activity.
For comparison purposes, it is worth evaluating the results when ignoring selection bias and parallel trends. These estimates are assuredly biased, but they show how ignoring the critical assumptions of DID analysis might provide misleading policy recommendations. The δ coefficient and the coefficient on the false treatment (δ’) are provided in Table 3. Equation (1) is estimated, and the regressions are unweighted.
In Table 3 we see that the δ coefficients are all positive and statistically different from zero. Such results might be used to suggest that 5G had positive and statistically-significant effects on economic activity. Yet, the δ’ (false treatment) are likewise all positive and statistically different from zero, and δ’ > δ is most cases. Thus, addressing selection bias and parallel trends is essential, and doing so indicates no effect of 5G deployment in county-level economic outcomes. The apparently favorable results on δ in Table 3 are entirely the consequence of selection bias.
Although improvements in modern wireless technology may provide benefits to consumers and specific use cases, the evidence does not support claims that these technologies fundamentally transform broader economic outcomes. Policy decisions should be rooted in a realistic assessment of relevant marginal costs and benefits.
Limitations
The limitations of this empirical analysis are somewhat apparent, with selection bias likely and a lack of parallel paths having strong support for most of the outcomes. Both concerns are addressed empirically using standard procedures, but the analysis required multiple adjustments to fit the requirements of DID analysis. It is a challenging problem. Causality is plausible but not guaranteed.
Also, there is great reliance on the county-level fixed effects, since only the treatment variable is included as a regressor. Given the mobile wireless industry’s claim that 5G is “technological paradigm shift, akin to the shift from typewriter to computer,” it is difficult to select covariates that are unaffected by the treatment. Thus, the simplest approach is used.
Also, the transition period between pre- and post-treatment period crosses the Covid line. Some counties may have recovered better than others, and this possibility has not been taken into account.
Conclusion
The empirical analysis presented in this Perspective finds no evidence that 5G deployment has delivered the massive economic benefits promised by the mobile wireless industry. Despite claims that 5G would generate $1.4 to $1.7 trillion in GDP and create 3.8 to 4.6 million jobs, this analysis finds no statistically significant positive effects on employment, wages, business establishments, personal income, or GDP across U.S. counties with varying levels of 5G coverage.
While the mobile wireless industry should be commended for its large capital investments in modern broadband infrastructure, which is surely advantageous in maintaining quality mobile wireless services, the disconnect between industry hype and economic reality has important policy implications. As the mobile wireless industry begins to promote 6G technology and lobby for additional spectrum allocations, policymakers should approach industry claims about economic transformation with appropriate skepticism. Although improvements in modern wireless technology may provide benefits to consumers and specific use cases, the evidence does not support claims that these technologies fundamentally transform broader economic outcomes. Policy decisions should be rooted in a realistic assessment of relevant marginal costs and benefits.
Ultimately, while broadband technology improvements are worth pursuing, government funding allocations, spectrum policy decisions and regulatory frameworks should be based on realistic assessments of relevant margins rather than industry marketing campaigns. Policymakers would be well-advised to set aside the hype and focus on evidence-based expectations when formulating spectrum policy.
Footnotes
[1]: Boston Consulting Group, supra n. 1.
[2]: Lopez and Martin, supra n. 1.
[3]: Ovide, supra n. 2.
[4]: Id.
[5]: N. Huntington-Klein, THE EFFECT (2022) at p. 280.
[6]: A.I. Naimi, E.E.M. Moodie, N. Auger, and J.S. Kaufman, Constructing Inverse Probability Weights for Continuous Exposures;
a Comparison of Methods, 25 EPIDEMIOLOGY 292–99 (2014).
[7]: J.D. Angrist and J. Pischke, MASTERING ‘METRICS: THE PATH FROM CAUSE TO EFFECT (2015) at §5.2.
[8]: Sufficient data from prior years is collected to compute the five-year growth rate in population.
[9]: A few counties are pairwise deleted due to missing data in one or more years.