Not All Affordable Connectivity Enrollees Are Using the Benefit: A Look into 30 Major Metro Areas
‘The percentage of households in major metro areas…using the program is smaller than the percentage of households enrolled.’

Since the launch of the Affordable Connectivity Program last January, millions of households have benefitted from the $30 per month connection subsidy to help pay for their broadband bills. The program serves as a necessary bridge in a failed marketplace, dominated nationally by a small number of regional monopolies driven by shareholders to charge the highest price possible.
Along the way, ILSR and a host of other research and advocacy organizations have been digging into the American Connectivity Program data in order to better understand how the program has operated over the last year, and how we can work collectively to improve education and outreach efforts and make sure as many households as possible will benefit. From this work we created an ACP Dashboard to collect and visualize useful data to support the critical work of digital navigators, nonprofits, and local governments.
Explore the Affordable Connectivity Program here, and read more about why we created it.
Recognizing the Gap
In addition to tracking how much of the $15.5 billion fund ($1.3 billion was carried over from the Emergency Broadband Benefit and $14.2 billion was allocated for the ACP] is left and predicting when it’ll run out (April 2026 at current rates), keeping an eye on state- and zip-code level use and enrollment, and following what types of connections households are using the benefit to pay for, an important part of this work has been tracking data across major metropolitan areas across the country.
As we continue to analyze the data and refine our tools to support work at the local level, we have found that the percentage of households in major metro areas (and likely elsewhere) that are actually using the program is smaller than the percentage of households enrolled in the program.
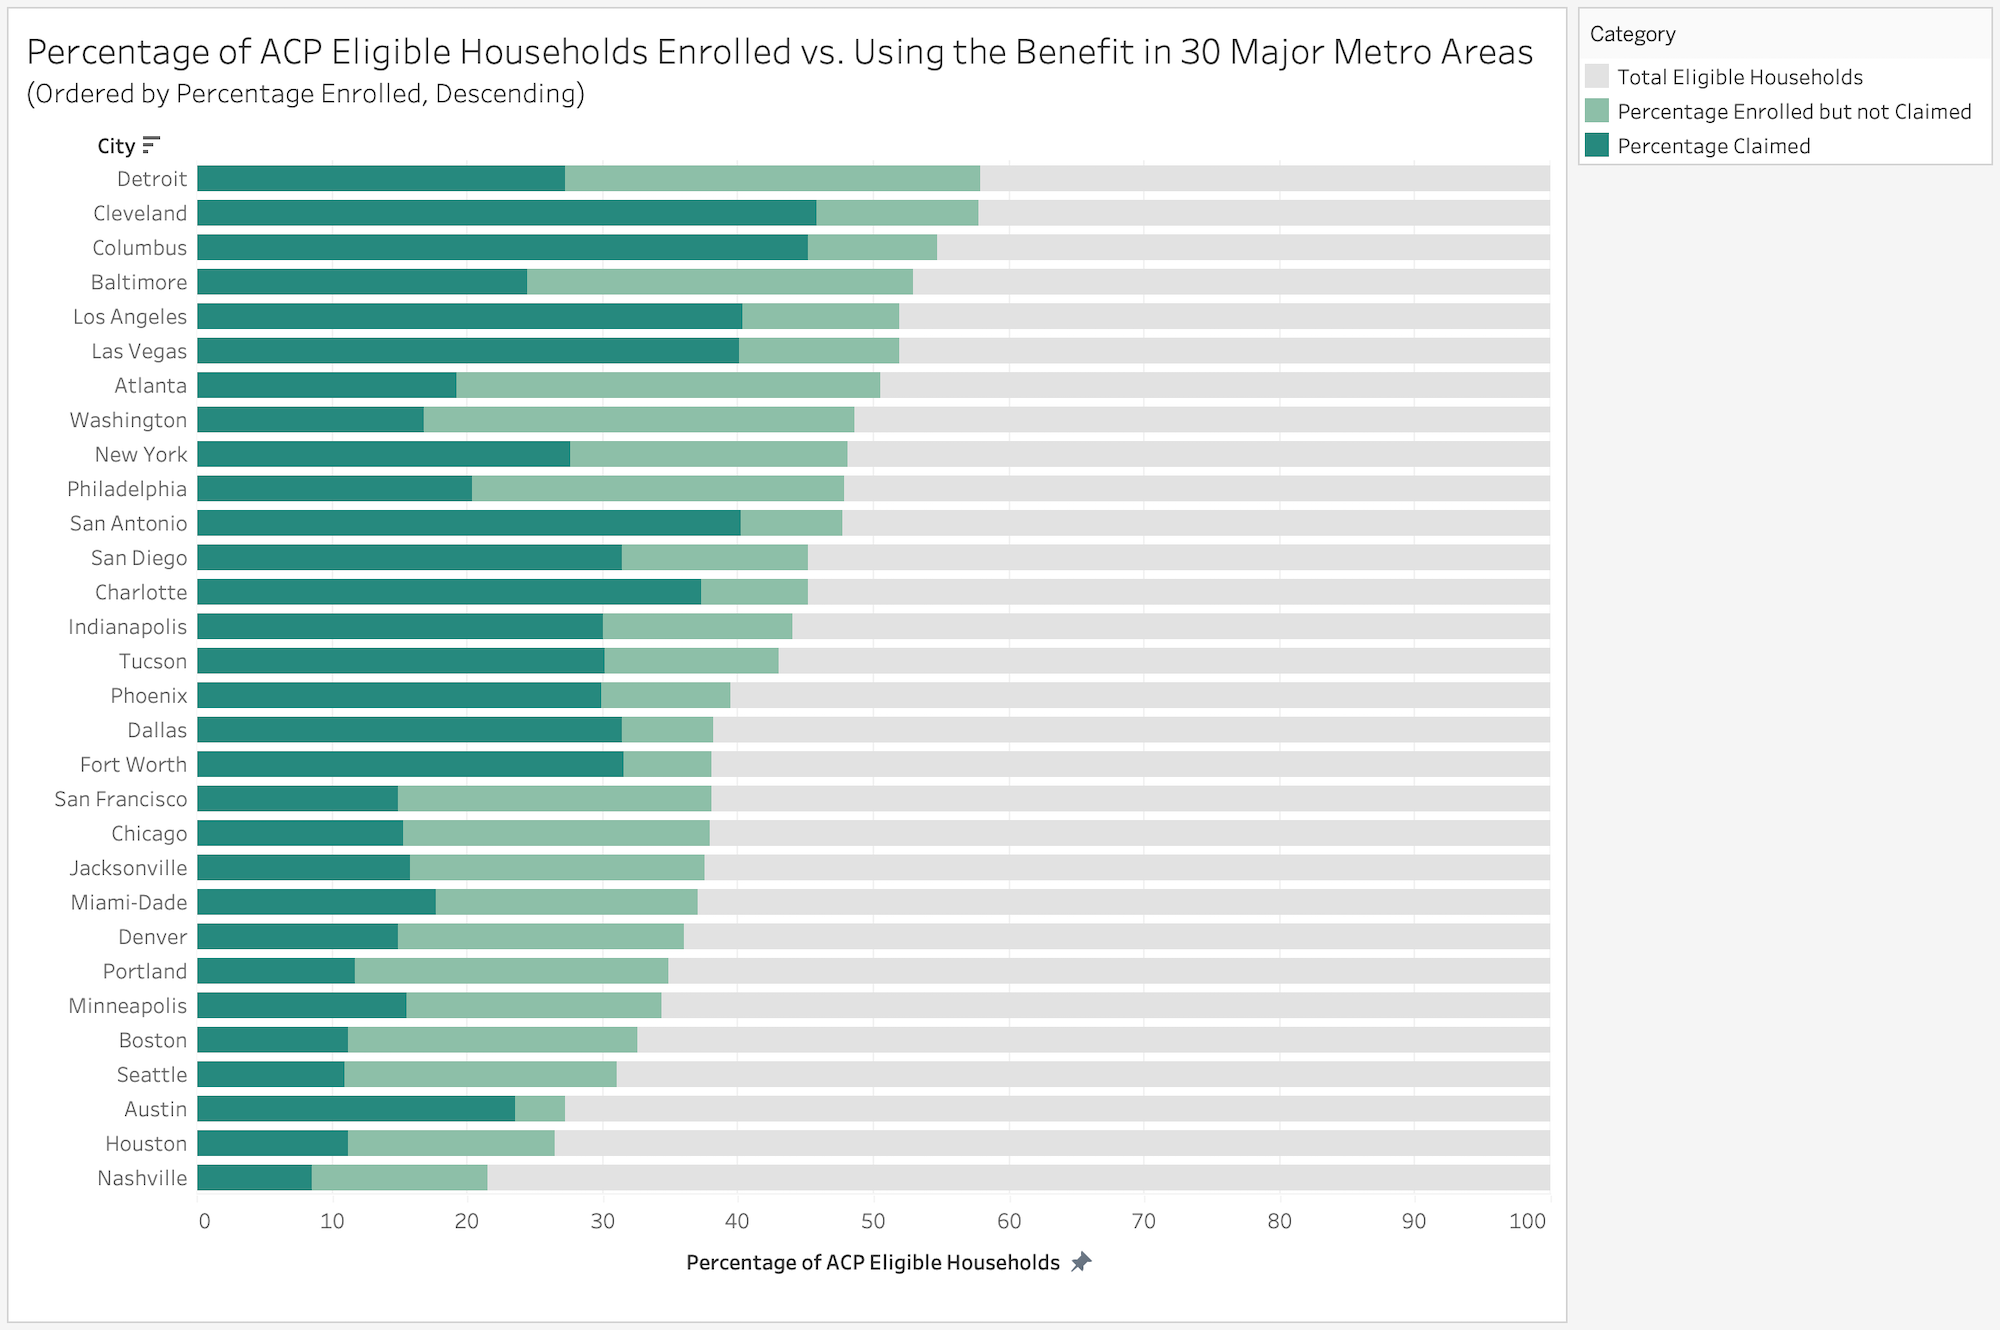
While a community’s ACP enrollment rate has been understood as an indicator both of its overall need for financial support and the effectiveness of local outreach efforts to sign up eligible households to participate in the ACP, the rate of claimed subscribers reflects the real effect of the program on that community. Here, we take a look at what the gap between enrollment and subscription looks like across 30 major metropolitan areas.
Currently, the major metro areas with the highest ACP enrollment rates are Detroit (58 percent of eligible households enrolled), Cleveland (58 percent), Columbus (55 percent), Baltimore (53 percent), and Los Angeles (52 percent). Only Cleveland, Columbus, and Los Angeles, however, also appear among the top five areas for greatest percentage of eligible households using the benefit (Cleveland: 46 percent claimed subscribers, Columbus: 45 percent, Los Angeles: 41 percent).

When we dive further into the metro area data, we can get some sense of why some cities are succeeding in not only enrolling households, but making sure they are using the benefit. For instance, San Antonio is on the list of top-five metro areas for use, despite being ranked 11th for enrollment.
At present, only 16 percent of enrolled San Antonio residents are not using the benefit. Why? The city has dedicated resources to staffing field organizers, who go door to door in low-income zip codes and talk to residents about the program, offering information both in English and in Spanish. Similar efforts are underway in Los Angeles, where there is only a 12 point difference between enrolled households and those using the benefit. Los Angeles also has a coalition of groups doing their own funded and unfunded community outreach to raise awareness of the program.
On the other hand, the following areas have relatively high enrollment rates but show large discrepancies when looking at the number of claimed subscribers:
Washington, DC: 49 percent of eligible households are enrolled, but only 17 percent are using the benefit.
Atlanta: 49 percent of eligible households are enrolled, but only 17 percent are using the benefit.
Detroit: 51 percent of eligible households are enrolled, but only 19 percent are using the benefit.
Baltimore: 53 percent of eligible households are enrolled, but only 24 percent are using the benefit.
Philadelphia: 48 percent of eligible households are enrolled, but only 20 percent are using the benefit.
Cleveland and Detroit both have an enrollment rate of 58, but Cleveland has a significantly higher percentage of households using the benefit, likely the result of years of dedicated efforts by DigitalC and the Cleveland Foundation to close the digital divide. Portland has the greatest relative discrepancy between enrollees and households using the benefit, with more than two thirds of its enrolled households not using the credit.
Reflecting the Gap in Our Tools
To reflect the significance of these gaps, while an earlier version of our ACP Dashboard focused on enrollment rates, we’ve adjusted our methodology to use the Total Claimed Subscriber number to calculate current ACP usage rates and predict future funding levels. We believe using Total Claimed Subscribers reflects a more faithful representation of usage rates and the rate of funds being depleted. A future iteration of the dashboard may further investigate the discrepancy between percentage enrolled and percentage claimed.
Explaining (and overcoming) this gap between enrollment is important, but we need more data to do so. It’s possible that some ISPs are deciding after some period of time that it’s not worth the resources to administer it and participate. It could also result from families getting enrolled by their ISP but not understanding that the benefit is available to them, or not having the digital literacy skills to use it.
The gap could also result from the way that the FCC verifies households’ eligibility, and regularly de-enrolls households it (sometimes erroneously) decides no longer qualify. We need more granular data from the Universal Services Administrative Company and the Federal Communications Commission to better understand why this gap between enrolled and claimed users continues to grow.
The policy implications and our analysis of the efficacy and future of this program stand: if anything, these numbers reflect less success in education and outreach efforts nationwide.
Check out the ACP Dashboard for more information. Special thanks to Drew Garner for his insight and feedback on the USAC data.
Authored by Emma Gautier, this article originally appeared on the Institute for Local Self Reliance’s Municipal Broadband project on October 26, 2022, and is reprinted with permission.


Member discussion