State Broadband Maps Show Significantly Fewer Served Locations than Does FCC’s Map
There is a ‘massive difference’ between federal Form 477 data and state maps in Georgia and North Carolina

WASHINGTON, September 30, 2022 – State broadband maps from North Carolina and Georgia show significantly fewer served locations than do the Federal Communications Commission’s existing data, said a panel at a Fiber Broadband Association web event Wednesday.
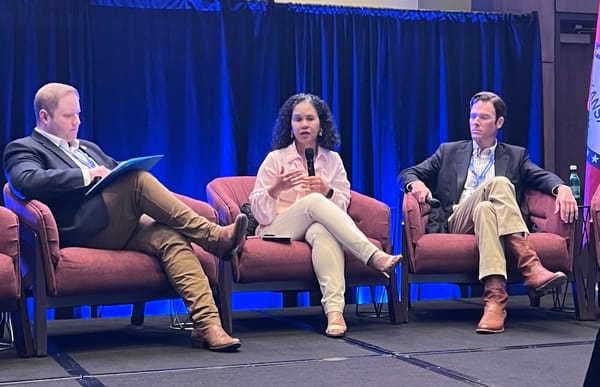
For us there is “a massive difference” between Form 477 data and Georgia’s data, said Eric McRae associate director of the Carl Vinson Institute of Government at the University of Georgia. McRae said the number of Georgians the FCC identifies as unserved is “miniscule,” while the state’s estimate is between 1 and 1.2 million unserved.
North Carolina also found the federal data lacking: “There are thousands of people that are technically in FCC considered served blocks that typed in their address and said they had no access or came in with 1 megabit or horrible speeds,” said Ray Zeisz, senior director of the Technology Infrastructure Lab at North Carolina State University’s Friday Institute. “We verified, certainly, that the data was overstated.”
With the two state-mapping leaders, J. Randolph Luening, founder and CEO of Signals Analytics, presented the findings of his recent report, which compares data from Georgia and North Carolina’s maps to the FCC’s Form 477 data.
Luening’s report outlines the contrasting methods employed by North Carolina and Georgia. North Carolina collected – and published – the results of 109,000 speed tests, measuring download and upload speeds, latency, and jitter. The Tar Heel State also gathered information on technology type, service provider, and other relevant factors.
Georgia’s process is more like the FCC’s current map-making process: It created a fabric dataset and solicited coverage data from providers on an iterative basis. The Peach State published its data in block-by-block form.
Unlike the maps generated from Form 477 data, Georgia’s maps show the percentage of served locations in each census block. “We’ve been able to get a very accurate count of the number of unserved locations that we have in the state of Georgia,” McRae said.
Imprecisions and inaccuracies in Form 477 data were largely responsible for the inception of the FCC’s current location-by-location mapping project. The Commission is still constructing this map and will accept challenges to the accuracy of its fabric dataset on a rolling basis. The map will be used to apportion among the states $42.45 billion from the Broadband Equity, Access, and Deployment program.
McRae and Zeisz agreed a state must launch its own mapping initiative to check the accuracy of federal maps and ensure receipt of its fair share of BEAD funding.


