Tom Reid: Accountability in Broadband Maps Necessary for BEAD to Achieve Mission
The sheer magnitude of the overstatements in the FCC’s map makes the challenge process untenable.
Tom Reid

With millions of American households stranded in the digital desert, we need to achieve accountability in broadband to make sure the Broadband Equity, Access and Deployment funding achieves its mission. The broadband gaps can be readily identified despite the air of mystery surrounding the topic.
Broadband improvements have been constrained for decades by inaccurate maps, yet the Federal Communications Commission continues to accept dramatically exaggerated availability and capacity claims from internet service providers. The cumbersome challenge process requires consumers and units of government to prove a negative — a logical fallacy.
The Reid Consulting Group and other parties, including Microsoft, have developed robust algorithms to reliably identify actual broadband availability. RCG utilizes Ookla Speedtest Intelligence data due to the large quantity of consumer-initiated tests. In Ohio, as an example, we draw on more than 16 million speed tests reflecting the lived experience from millions of households. We combine the speed test findings with FCC and Census data to deliver irrefutable identification of unserved and underserved locations.
Such methodologies offer State Broadband Leaders the opportunity to reverse the burden of proof in the BEAD program, requiring that ISPs submit concrete evidence supporting their availability and speed claims. As an example, in Ohio, RCG’s maps were accepted as proof of unserved status for the 2022 state grant program. BroadbandOhio then required ISPs to submit substantial proof in their challenge process. In other words, the ISP’s were tasked with proving a positive instead of expecting citizens to prove a negative.
ISPs and the FCC denounce crowdsourced data unless conducted under unusually restrictive conditions. The ISPs have successfully promoted unsubstantiated myths regarding the value of consumer-initiated speed tests.
Myth: Bad tests are because of poor Wi-Fi.
Reality: RCG eliminates speed tests with weak Wi-Fi and includes GPS enabled wired devices. Even first-generation Wi-Fi would saturate a 25 Megabits per second download and 3 Mbps upload connection.
Myth: Residents only subscribe to low-speed packages.
Reality: According to the National Rural Electric Cooperative Association, in areas where rural electric cooperatives offer broadband, 25 to 33 percent of rural subscribers opt for the top speed tier offered. We can clearly see this trend in areas where fiber has been deployed in recent years, as described later in this article.
Myth: People only test when there is a problem.
Reality: Network problems prompt tests, as do resolutions of problems. RCG recommends focusing on the maximum speed test results to eliminate this “unhappy customer effect.”
Finding the truth: Broadband and the lived experience
In Ohio, RCG analyzed more than 14 million consumer-initiated speed tests over a three-year period. The data reveals a clear pattern of carrier overstatement. The stark visual contrast between the two maps is hard to ignore — and while this study is focused on Ohio, the issue remains nationwide in scope. The sheer magnitude of the overstatements makes the FCC challenge process untenable.
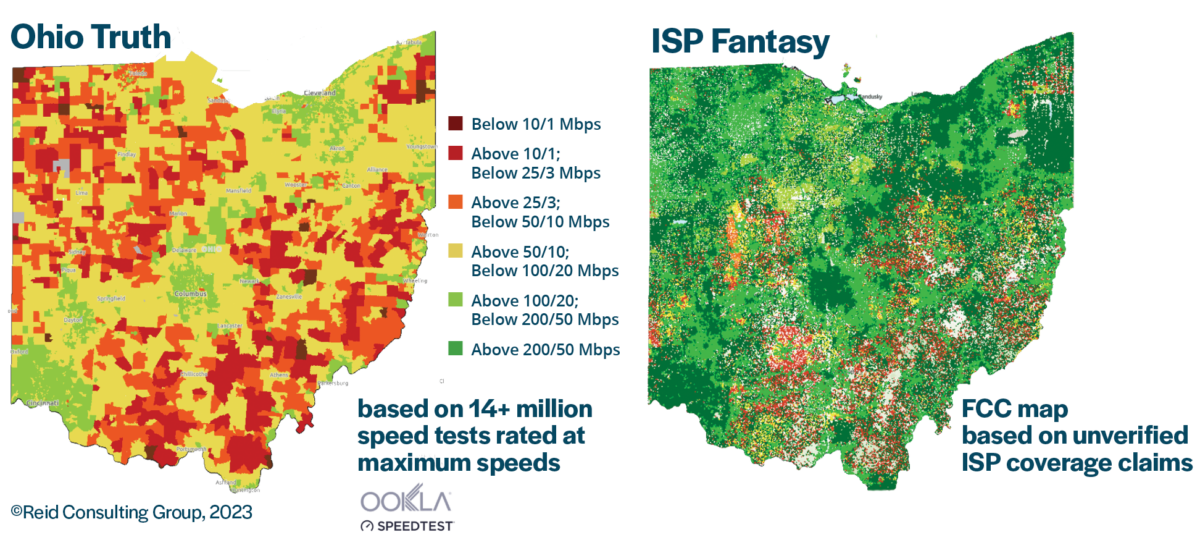
Figure 1: Ohio Broadband Reality vs. FCC ISP stated coverage map.
RCG utilized the “maximum speeds ever seen” at a location for generating maps and coverage figures, but we also examined the results from the average of speed test. Switching between average and maximum speeds does not change the overall picture of broadband availability. As an example, Figure 2 focuses on an area around Bolivar, Missouri. Looking at the maximum speed turns Bolivar itself a deeper green, meaning “better served,” but the rural areas around Bolivar remain predominantly red, meaning “unserved.” The preponderance of evidence clearly demonstrates that much of the rural area around Bolivar remains unserved, even at maximum speeds.
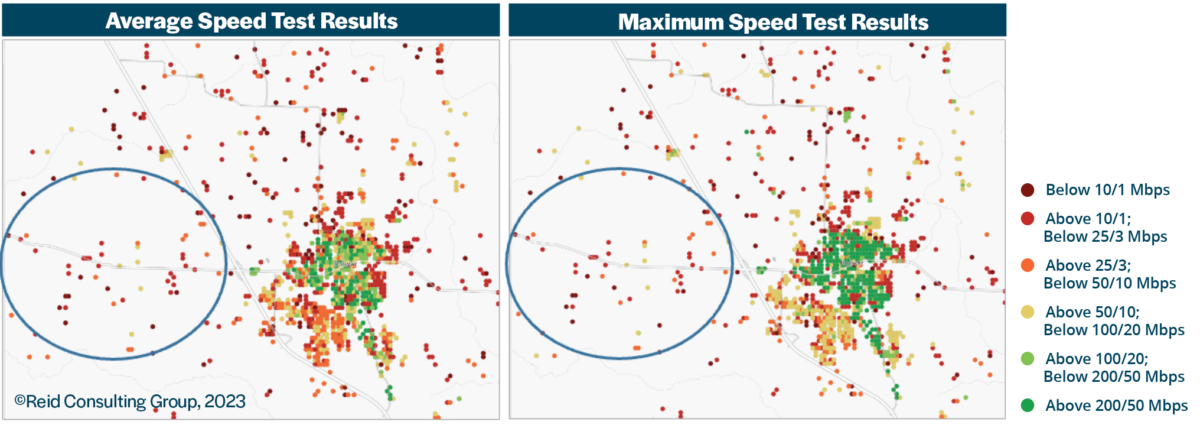
Figure 2: Map visualization illustrating the difference between viewing average speeds in the Bolivar, Missouri area and maximum speeds documented.
When rating broadband availability in the Bolivar area at the Census block level and overlaying with ISP coverage claims at the H3 R8 level, you can see that many of the unserved and underserved areas have been reported as served to the FCC by ISPs (Figure 3).
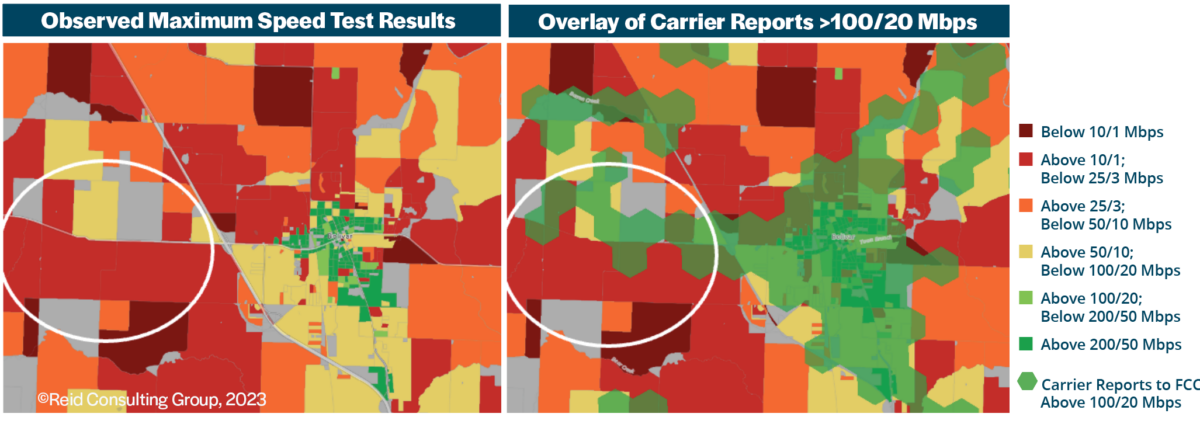
Figure 3: Carrier overstatement small scale in Bolivar, Missouri. RCG speed map with FCC H3 R8 hexagon overlay.
Zooming out to examine the entirety of Missouri (Figure 4), the pattern of ISP overstatement becomes quite clear. According to the FCC maps, most of the state is served, whereas the analysis conducted by RCG shows that significant areas remain in need of broadband investment. As with Ohio, the scope of the overstatement in Missouri presents an unreasonable burden on the public to challenge.
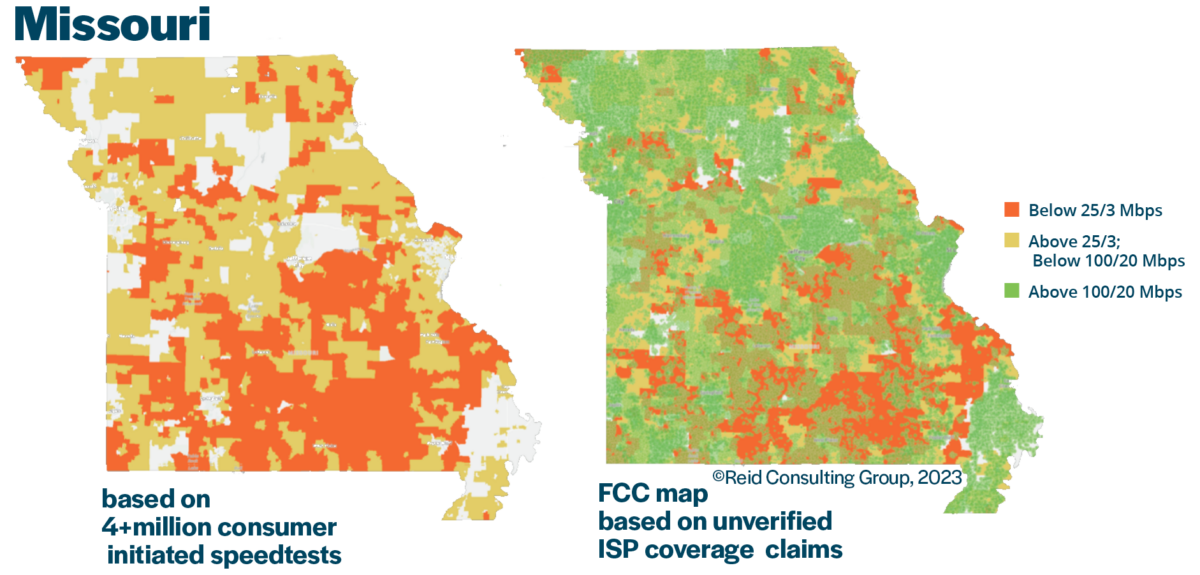
Figure 4: Missouri reality vs. ISP Reports, March 2023.
Showing Progress: Change of State Analysis
Change-of-state analysis taps progressive releases of Ookla records to identify areas where broadband speeds have set new highs. This approach works not only for grant funded projects but also private investments. The area surrounding Byesville, Ohio (Figure 5) reveals a significant uptick in test volume, test locations, and speeds from 2020 to 2022. Side-by-side comparison shows a large number of “green” (served) speed test locations where there used to be only “red” (unserved) and “orange” (underserved) results. This change is a direct result of a Charter Communications Rural Digital Opportunity Fund deployment.
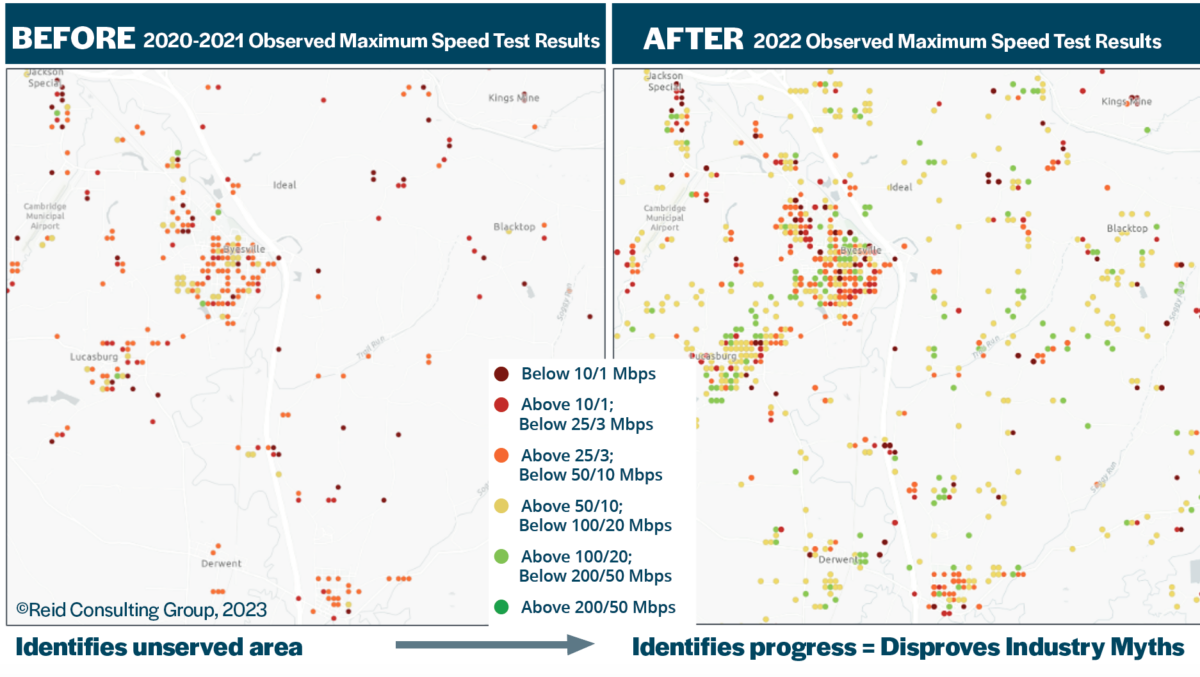
Figure 5: The unserved area around Byesville, Ohio before and after broadband deployment.
State Broadband Leaders can use these capabilities to document progress and identify lagging projects. Any service area will always exhibit a mix of speed test results. Even in an area like Byesville where fiber-to-the-home has been deployed, not all the location “dots” will turn green. However, the preponderance of evidence clearly shows that a funded ISP — in this case, Charter — has made good on its commitment to expanded broadband access. ISPs can help by conducting speed tests at the time of installation from the customer’s premises and by increasing minimum packages to 100/20 Mbps or higher.
There is no mystery to solve — we know how to identify areas lacking broadband services. For many rural Americans, even their telephone services have become unreliable, still dependent on the now-decrepit copper cables built in the 1940s through 1960s. We all depend on a healthy rural economy for our food, water and energy. Let’s make the commitment to build the infrastructure needed to bring these households into the internet age — starting by bringing reality and accountability to the availability maps.
Tom Reid is the president of Reid Consulting Group, a firm specializing in broadband. They work with clients to generate insights, create actionable plans, and identify funding sources to connect unserved and underserved areas. RCG’s engagements in eight states have delivered 6,000 miles of fiber construction with a total project value of $1.6 billion and has secured over $330 million in grant funds on behalf of clients. This piece is exclusive to Broadband Breakfast.
Broadband Breakfast accepts commentary from informed observers of the broadband scene. Please send pieces to commentary@breakfast.media. The views expressed in Expert Opinion pieces do not necessarily reflect the views of Broadband Breakfast and Breakfast Media LLC.









Member discussion