Mike Conlow: There Really Is Enough Money to Reach Most of the Unserved and Underserved
Estimating how far the money will go does not require advanced math.

Last week a wireless company published a study about the cost to reach all the Unserved and Underserved. They estimated we need $307 billion to reach everyone. Similar reports have come out before. Generally they make a case that BEAD will run out of money, so the federal government should settle — for wireless technology, or FCC subsidy programs outside the scope of BEAD.
Like previous versions, this one too doesn’t represent the real situation. We have almost enough money to reach all the Unserved and Underserved, except for states that are particularly high cost.
Estimating how far the money will go does not require advanced math. We need an average cost to reach a location, and the total number of locations. There are 12.8 million Unserved and Underserved locations nationally. Instead of using the FCC data, the wireless study estimates this number from Census data, then adds 10% assuming growth from challenges to arrive at 16 million locations. That’s one difference.
The study breaks down these locations by the density of their Census tract. That’s a reasonable approach. Density is the primary driver of cost to serve a location, and is a decent proxy for other important things like terrain. When we break down the 12.8 million location Digital Divide by density, the peak is between 20-50 housing units per square mile. There are 2.7 million locations in that density range. There are about 1.5 million locations each in the least dense bucket 0-5 housing units/sq mile and the bucket between 5-10 hu/sq mi.

Now turning to the price per location at each of these intervals. I use the reserve prices from the RDOF reverse auction to estimate cost per location served by fiber. The reserve prices are not the winning bid from the RDOF auction. Instead, they are the price below which the FCC was willing to fund a project. If you add up all the RDOF reserve prices, it was $26.5 billion for 5.3 million eligible locations, or $5,000 per location. These prices are very clearly derived from the FCC’s cost model (built by CostQuest) and may be the cost model itself. Regardless, they certainly order locations correctly — more rural locations have a higher reserve price than urban locations.
As I’ve done previously, here I’m inflating the RDOF reserve price by 25% to capture changes since the RDOF auction like inflation, supply chain issues, and other things. When you plot these prices against the density of the Census block groups they cover, you see the expected hockey stick-like increase in cost. At less than 5 housing units per sq. mile the cost per location is $13,243 per location. It drops quickly: between 5-10 hu/sq mi the cost is $9,154, and when it reaches the mode at 20-50 hu/sq mi the cost is $6,015. In the most dense areas, the cost per location is $1,150. The overall average is $5,266 per location.

(As an aside, there are 373,000 BDC Unserved and Underserved locations in Census block groups with zero density. How does that happen? The Census counts housing units, not businesses. A Census block that is entirely businesses has 0 housing units and thus 0 density according to this metric using Census data. )
If you add up all these costs — the number of locations in each group times its average cost — you get $64.5 billion to reach all of them with fiber. That number includes the private capital match of at least 25%. The tab to BEAD alone is $50.6 billion. Remember also that this rough estimate doesn’t factor in the significant RDOF commitment to fund locations, nor ARPA, nor some locations which will be Extremely High Cost and therefor they won’t get fiber. Even if you inflate the RDOF cost by 50% it only brings the total to $81 billion, without any deductions for RDOF, private capital match, etc. I see no way to get $307 billion as this study did.
Below is the summary of how the wireless study reaches the conclusion about needing $307 billion in investment. The distribution of locations by density is not all that different. They have 6 million locations below 20 housing units/sq mile. I have 4.9 million. However, according to the BDC data there are over 1 million locations in blocks with density above 750 hu/sq mi which have a very low cost and is not reflected in this study.
Probably the biggest difference is the cost per location applied to that lowest density group. They appear to give a cost of $18,100 for every location under 20 hu/sq mi. I don’t disagree that the cost curve bends upwards for the lowest density areas, but I think the bend starts happening at 10 housing units / sq mile or even lower. There probably are locations that cost $18,000 to reach them, but it isn’t fair to apply that average across every location below 20 hu/sq mile. I can’t replicate how they get $191 billion to serve that lowest density group. Six million locations times $18,100 per location is $108.6 billion, not $191. That’s a big difference. Maybe there’s some methodological aspect I’m not following.

About the same time that this study was published, Cost Quest put up a blog post about cost curves. Using a state which they don’t name, they provide a cost curve chart by percentile for Unserved locations. The average cost per location in this state is $5,589, in line with the estimates I use for average cost per location nationally. Their cost curve starts to increase significantly for the last 10% most expensive locations in the state. It really hockey sticks for the hardest to reach 5% of locations.

If we apply this logic to the national distribution of Unserved and Underserved locations by density, it means costs start to rise for least dense 10% of locations — 1.3 million locations. And really hockey sticks for the last 650,000 locations. While it is interesting to consider these locations, no state is going to try to build fiber to them. NTIA created the Extremely High Cost Location threshold for exactly this purpose. According to NTIA, the EHCL threshold is a price above which a state “may decline to select a proposal if the use of an alternative technology meeting the BEAD Program’s technical requirements would be less expensive.” How high the cost curve reaches doesn’t matter. They’ll be EHCLs and won’t get fiber.
Implicit in my contention that there’s [almost] enough money to reach all the Underserved and Unserved nationally is that BEAD grants are awarded competitively and close to the true cost to serve the location. Consider the example Cost Quest state above. They have a statewide average of $5,589 per location. But about 62% of locations are below that average. Some of these locations are on the “network edge” — an ISP provides service on the block, or next door. Some of them are dense towns served by DSL now. It is critical that this state generates competition for these areas and finds a proposal close to the true cost to serve the location. If they fund all these locations at the statewide average of $5,589 they could waste $2,000 or more per location.
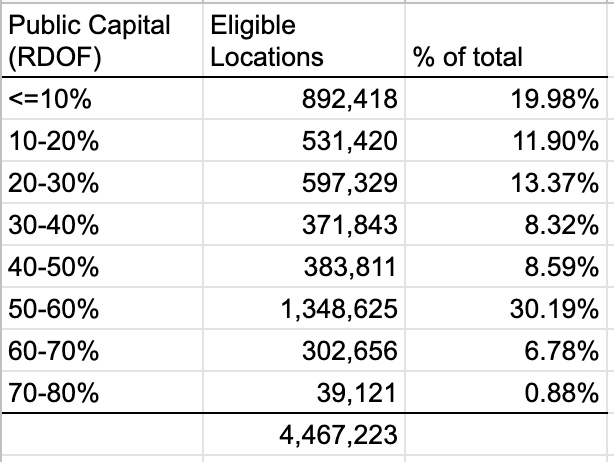
We know private capital is willing to bring most of the capital for these low-cost locations because that’s exactly what happened in RDOF. Private capital brought more than 90% of the necessary funding in 20% of the locations that were won by providers planning to offer gigabit service. As a reminder, these location were unserved and relatively high cost. If private capital can bring most of the funding during RDOF, let’s find a way to bring the same level of private capital to state-administered grant programs.
There’s an important practical takeaway from all this: a public cost curve for every state is critical. States need it to set a reasonable Extremely High Cost Location threshold. But more importantly, states and the public need it to evaluate grant proposals. If states don’t have the cost curve data and the ability to run a grant program that optimizes on it, BEAD will run out of funding for sure, and it doesn’t matter whose numbers we use for estimation now.
Takeaways:
- NTIA should procure a national cost model that represents the unique contours of every state.
- NTIA should give that cost model to every state, and make it public.
- NTIA should provide guidance to states on how to set the Extremely High Cost Location threshold based on their individual cost curve.
- NTIA should provide guidance, and only accept plans from states, that encourage competition between ISPs, and that fund locations based on the underlying costs to reach those locations.
Mike Conlow is a longtime broadband data and Internet policy analyst. Prior to being involved in Internet policy he was in political technology, and was on both of President Obama’s campaigns, in 2012 as the Deputy CTO. This piece was originally published on Mike Conlow’s substack on April 25, 2023, and is reprinted with permission.
Broadband Breakfast accepts commentary from informed observers of the broadband scene. Please send pieces to commentary@breakfast.media. The views expressed in Expert Opinion pieces do not necessarily reflect the views of Broadband Breakfast and Breakfast Media LLC.