
White Paper
The Need for Ongoing Network Performance Monitoring by U.S. States
White Paper Provided by Bryan Darr, Vice President of Government Affairs at Ookla
Billions of dollars have already been deployed in the last several years to close the digital divide through state-directed projects with funding from the American Rescue Plan Act (ARPA) and the Capital Projects Fund (CPF). In 2026, we will finally start to see deployments begin with funding from the Broadband Equity, Access, and Deployment (BEAD) Program. State broadband offices are managing this unprecedented influx of federal funding, overseeing projects that are reshaping local economies, and transforming how communities access education, healthcare, and jobs.
The challenge now isn’t just about building networks; it’s also about monitoring the progress of delivering broadband to underserved communities. While the National Telecommunications and Information Administration (NTIA) sets broad guardrails for BEAD, most accountability for these expenditures ultimately falls on the states. Governors, legislatures, and local communities will all want proof that taxpayer-funded projects are delivering real, measurable improvements in connectivity and adoption.
In this White Paper, we’ll explore why traditional oversight and one-time site inspection isn’t enough, how regular monitoring can strengthen state broadband programs, and how Ookla’s data and mapping tools help agencies maintain transparency for monitoring performance over time.
The Accountability Challenge Beyond Federal Mandates
State broadband offices aren’t just following federal guidance—they’re responsible for demonstrating that public investments are delivering measurable improvements in connectivity. Governors, legislators, and community officials expect clear evidence that awarded projects are expanding coverage and improving network performance. ARPA and CPF projects have already been funding large-scale broadband expansion, but those programs do not include any significant federal requirements for long-term performance monitoring. As BEAD-funded buildouts begin, NTIA is expected to require limited ongoing verification similar to what has been implemented for the Connect America Fund (CAF).
Without broad, consistent network performance testing, states risk losing visibility into how billions in public funds are being used, undermining their ability to demonstrate results or enforce accountability. Legislators and local officials will increasingly demand that broadband offices demonstrate outcomes, not just project completion, and pressure for transparent, data-backed reporting is only growing stronger.
Key considerations for state broadband offices include:
- ARPA and CPF oversight gaps: Many of these earlier programs lack ongoing testing requirements, leaving states to fill the void with their own network performance monitoring standards.
- BEAD expectations: Preliminary NTIA guidance, released September 19, 2025, suggests that testing requirements will likely follow those already outlined for CAF. That equates to a minimum of 5 and no more than 50 testing locations being required per award area, depending on the number of locations served. Testing requirements do not extend beyond the award areas in an ISP’s footprint unless necessitated by other support programs.
- Public accountability: State agencies must be ready to justify funding decisions and results to policymakers and the public alike. Search engines, and now AI, have given all of us an expectation of immediate answers. While annual reports serve as important milestones, most stakeholders will have no more patience than the general public. There is a high value in having more current statistics and updated maps readily available.
As states shift from deployment to documentation, accountability becomes not just a compliance measure but a foundation of trust with ISP partners and a direct responsibility to the communities involved.
The Limitations of One-Time Physical Inspection
Regularly monitoring performance is the only way to know whether broadband networks are actually delivering on their promises over time. Inspecting a project once—checking that equipment is installed and operating—might confirm that a build is complete, but it doesn’t reveal how that network performs for real users after the ribbon-cutting. Physical inspections can serve an important purpose at an early phase, but the expectation is that these new deployments will continue to meet the performance metrics promised in their award applications, at a minimum, over the next decade and beyond.
Broadband networks evolve with population shifts, infrastructure upgrades, and increasing user demand. What performs well during an initial inspection may degrade over time due to usage congestion, higher than expected adoption, aging equipment, or inadequate maintenance. One-time field checks simply cannot capture:
- Actual user experience: A one-time test doesn’t reflect what residents see day to day.
- Performance trends: Ongoing data collection via crowdsourced testing reveals where service quality improves, plateaus, or declines.
- Adoption patterns: Geolocated test data helps identify whether networks are gaining traction across different communities.
NTIA uses Ookla data in its mapping tools to understand how connectivity looks at the community level—offering proof that consistent, crowdsourced insights add value far beyond one-time field inspections. Continuous visibility ensures states aren’t just checking boxes but improving outcomes for the people these programs were designed to help.
Speedtest Data Paints a Picture of Success
In the example below, we see the best 10% of Download Speeds for all fixed operators aggregated to Hex Resolution 7 in and around the Buena Vista, Georgia, community. The left image represents six months of Speedtest results ending on December 31, 2024. The right image represents six months of tests ending July 31, 2025 after new network equipment has been deployed.
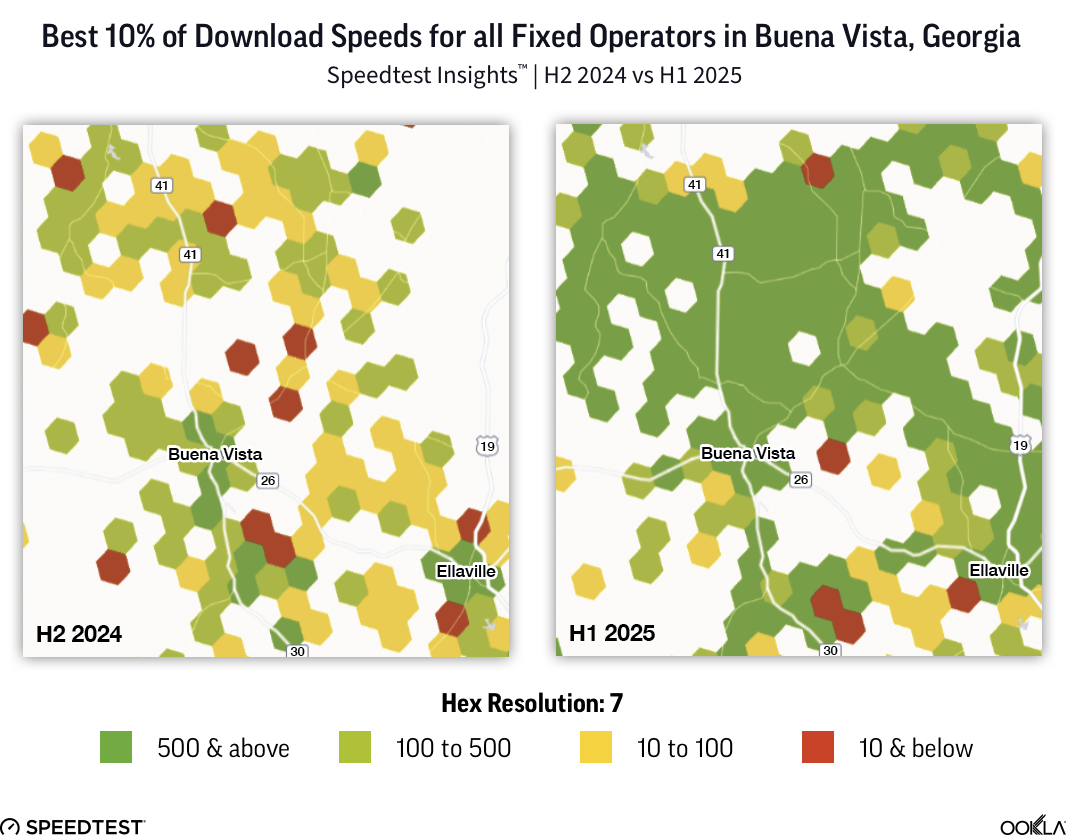
Areas on the left map shown in yellow saw the best 10% of Speedtest results below 100 Mbps. Those in red saw the best 10% of Speedtest results at less than 10 Mbps. These same areas, six months later, broadly show best speeds over 500 Mbps. In fact, many areas shown in dark green have best speeds results above 900 Mbps (see chart below). This constitutes broad evidence that residents in proximity of Buena Vista, Georgia, have seen an astonishing improvement in their access to high quality broadband.
The “Best 10%” metric is used to better represent what the ISPs are capable of delivering to their subscribers as opposed to the variety of experiences users have beyond the gateway. In contrast, median speeds are often used to competitively benchmark ISP performance. In Q3 2024, the median download speed on the Download chart below was 87.37 Mbps. By Q2 2025, the median speed had jumped to 211.73 Mbps for an increase of 142%. These examples demonstrate how real-world, continuously updated Speedtest results can be used to monitor improvements over time within a community.
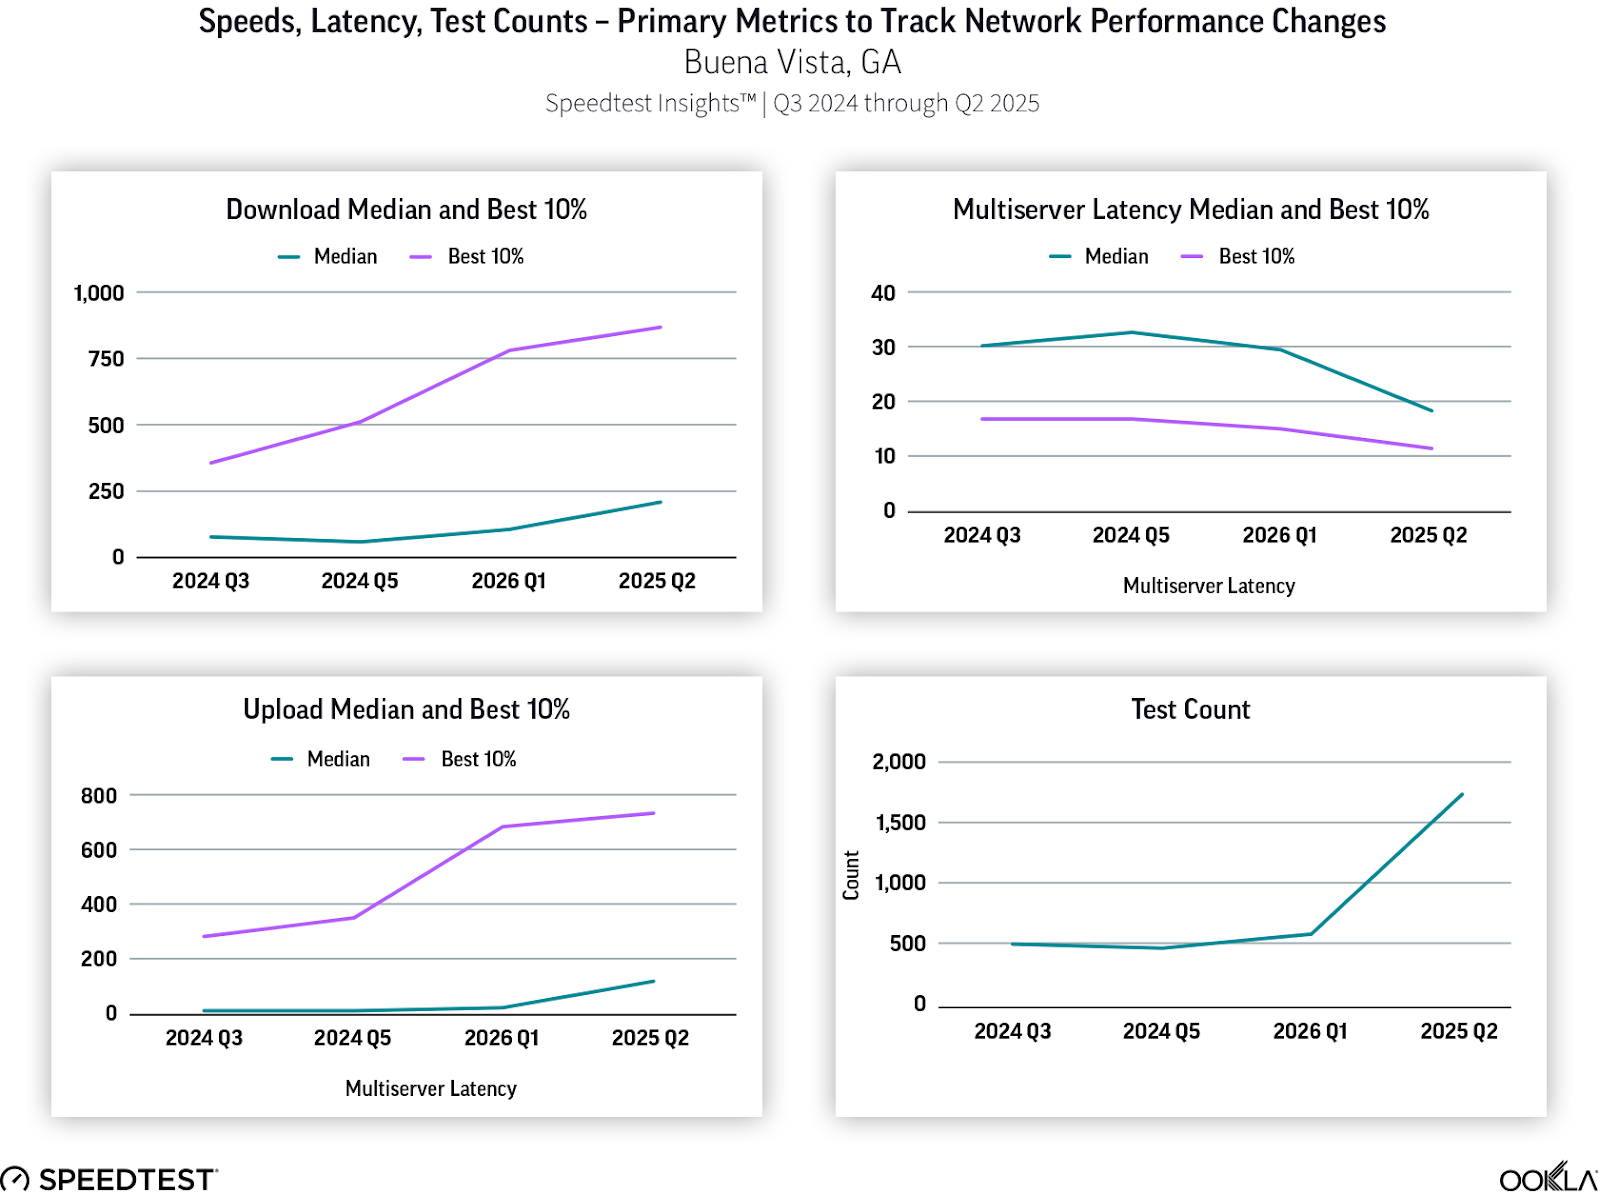
Upload speeds have also increased with the best 10% of tests improving by 151% and median speeds improving by over 708%. These boosts in upload speeds are a strong indicator of significant deployment of synchronous fiber within the study area. Multisever latencies are also moving in the right direction, with the best tests improving (or falling) by almost 34% and median results by 42%. Also noteworthy, as households gained access to new services, the number of Speedtest results jumped from 1,008 in the earlier six month period to 2,352 in the latter six month period. This represents a 133% increase in testing activity as both service technicians and subscribers validated the improved broadband access.
While all of these metrics and more can be broken out by individual ISPs, the purpose of these generic “All Providers” illustrations is to show how overall connectivity in an area can dramatically improve, whether from a single provider or from incumbents finding themselves pressured to improve and retain market share.
How States Can Implement Ongoing Monitoring
For most state broadband offices, accountability will not end when a project is marked complete. Leaders need to prove that networks are performing as promised, closing coverage gaps, and improving user experience long after construction wraps up. That level of visibility requires tools that turn speed and latency data into something decision-makers can easily interpret and act upon. State broadband offices can take accountability further by adopting platforms that transform large tables of testing data into actionable intelligence.
Ookla’s datasets and visualizations allow agencies to move beyond compliance toward ongoing transparency and smarter, data-driven decision-making:
- ArcGIS Layers: As an Esri™ partner, Ookla provides pre-aggregated data in formats that integrate directly with ArcGIS platforms. States can visualize broadband performance by census boundaries or hexagon grids, making it easier to track buildouts and evaluate service quality across geographies.
- Dashboards and Reports: State broadband offices require data that is ready-to-use and actionable. New pre-built dashboards display both current and historical trends in metrics such as speed, latency, and consistency. These views can be shown by state, county, or census block group, supporting quarterly and annual reporting, as well as benchmarking against all other U.S. states and territories. Custom reports are also available for deeper performance insights.
- Speedtest Insights™: Ookla’s Speedtest Insights data helps states identify mobile coverage gaps and highlight disparities in both urban and rural connectivity. Some states have their own initiatives to improve wireless coverage and also use Ookla data to inform funding strategies for unserved and underserved areas. Should non-deployment funds be approved for wireless infrastructure investment, it could prove to be another game-changer for solving the digital divide and it is anticipated that the FCC will be sharing guidance in 2026 on the $9 billion Rural 5G Fund.
Using these tools together gives broadband offices a current view of network health, helps track awardee performance, and ensures that investments translate into measurable improvements for residents and businesses.
Data-Backed Accountability: Best Practices for State Broadband Offices
State broadband programs have entered a new phase—one where oversight, transparency, and public accountability will be in demand as connectivity is already expanding using taxpayer subsidies. Physical inspection and limited performance checks will not meet the demands of governors, legislators, or the public. Ongoing monitoring, backed by trusted third-party data, is emerging as the new standard best practice.
Ookla’s datasets and visual tools give state broadband offices the means to see how well networks are performing in the real world, identify where support is still needed, and hold awardees accountable for promised outcomes. With ongoing visibility into performance, states can ensure their broadband dollars deliver long-term impact, genuine connectivity, and real accountability for every community they serve.
Reach out to us if you’d like to explore how Ookla data can support your efforts to expand quality broadband access to everyone.